Whether you deploy a single device or a fleet, monitoring your video compute infrastructure is critical to ensuring the best video streaming experience for your viewers. LiveEdge® Compute makes this easy by providing the Prometheus node_exporter module on each device.
To enable this module, you'll need to set up your development environment. Then run the following commands:
[Local Machine]: adb connect <YOUR DEVICE'S IP ADDRESS>
[Local Machine]: adb root
[Local Machine]: adb shell

[LiveEdge® Compute]: source /data/local/vstream/etc/env.sh
[LiveEdge® Compute]: setprop persist.videon.node_exporter 1
You can confirm that this module is installed and working by opening a browser window and entering the node_exporter's URL:
http://<YOUR DEVICE'S IP>:9100/metrics
The values on this URL update in real time when a call is made to the endpoint. Prometheus is an open source time series database that can be configured to poll this endpoint on a regular basis and take a snapshot of those values. Grafana presents the data collected by Prometheus on one or more dashboards to easily visualize what's happening within your systems.
If you already monitor infrastructure using Prometheus and Grafana, simply add the node_exporter URL to your Prometheus configuration and set up the appropriate Grafana dashboards. If you're not currently using the Grafana observability stack, you can set it up and have it running in under an hour.
To start, clone or copy the files from our example repository on GitHub to your local machine.
While you can run Grafana on a local server, for this example we'll use the Grafana Cloud. Visit the Grafana Labs homepage and create a free tier account. Log in to your new account and visit your Grafana Cloud Portal by clicking the "My Account" link in the upper right of the top navigation bar. You should see your Grafana instance in the left hand navigation of this page under the "Grafana Cloud" heading.
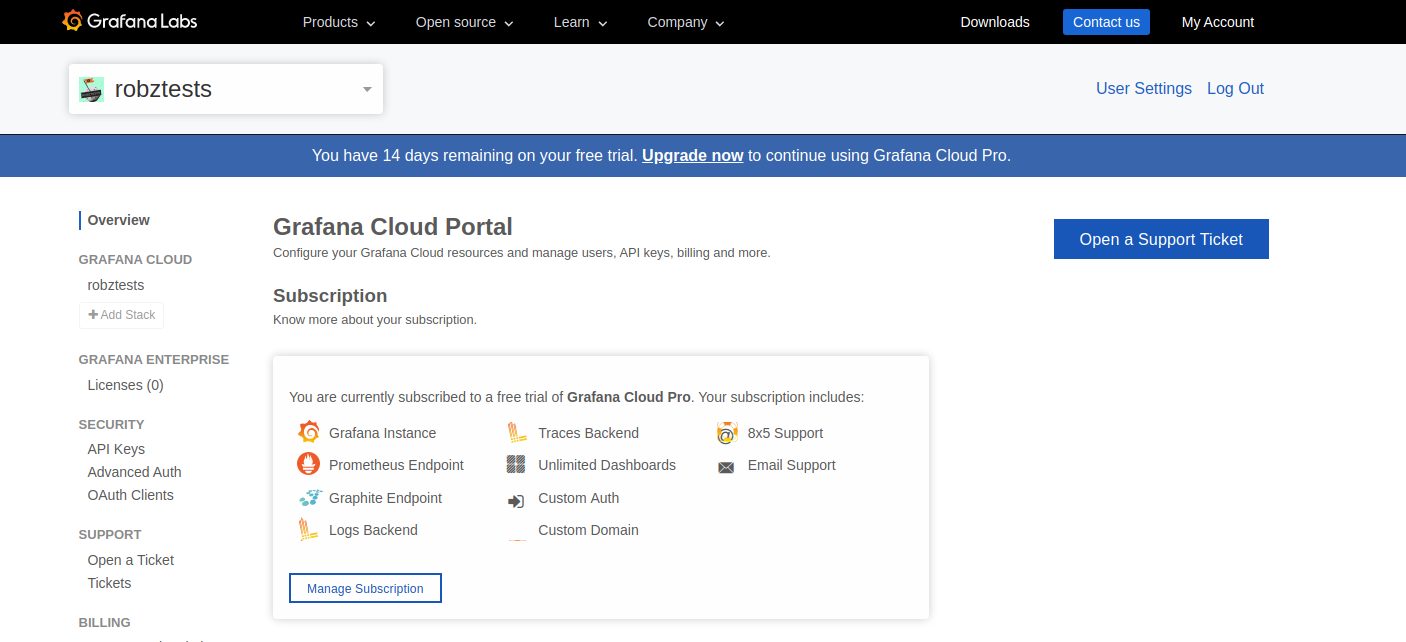
Click on the name of your Grafana instance to see the available subscriptions. Grafana allows you to monitor data flowing in from a number of sources. For our scenario, we want to monitor Prometheus, which should be near the top of the list.
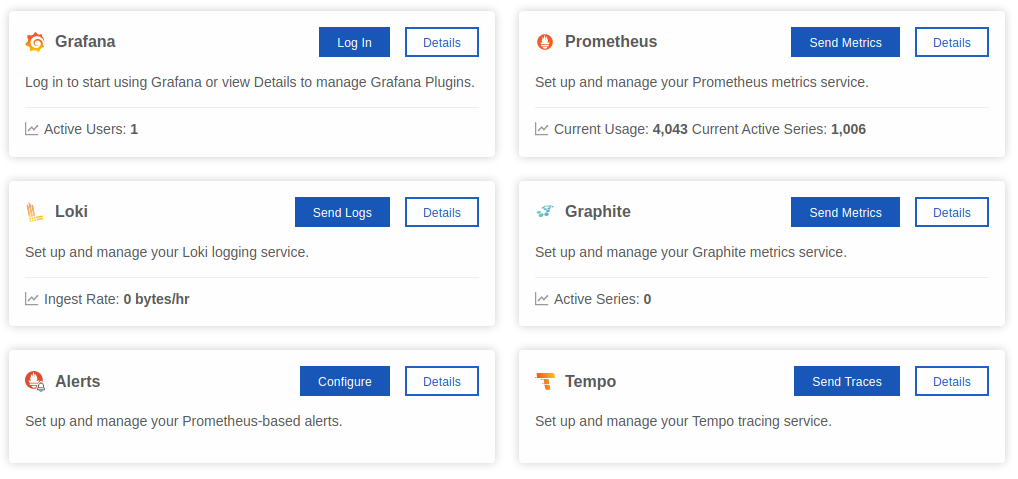
Click the "Send Metrics" button. This will present you with a "remote_write" configuration, which tells Prometheus where to send the data it collects for Grafana to display.
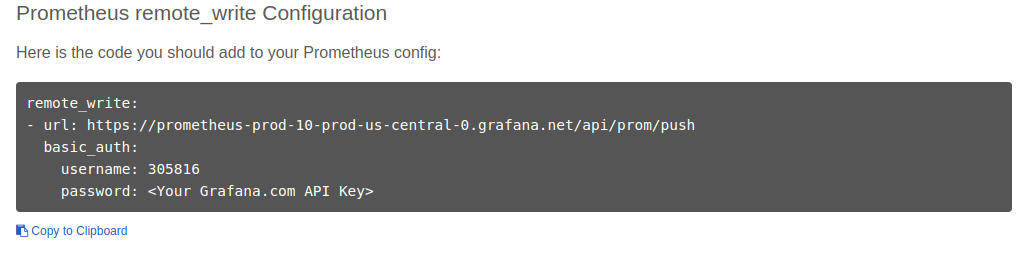
Copy this configuration and replace the dummy configuration data in the prometheus.yml file you downloaded from GitHub. Note that you also need to fill in your Grafana API key. To generate that, scroll down on the same page on Grafana to find the "Grafana Data Source Settings" section.
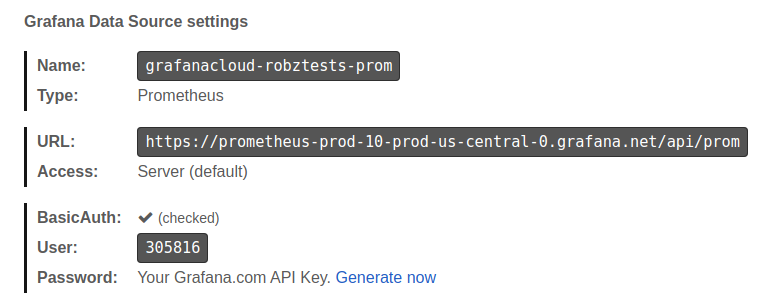
Click the "Generate Now" link next to "Your Grafana.com API Key". In the popup, give the key a meaningful name (e.g. "liveedgecompute") and select the role for "MetricsPublisher". Copy and paste the generated key in the appropriate place in the prometheus.yml file.
Note: You may notice the URL in the "Grafana Data Source settings" is slightly different than the one in the remote_write configuration. For this example, you should use the values in the remote_write configuration, which adds a "/push" to the end of the URL.
Use adb shell to log in to your device, source the environment, and create a directory to store the files you downloaded and edited.
[Local Machine]: adb connect <YOUR DEVICE'S IP ADDRESS>
[Local Machine]: adb root
[Local Machine]: adb shell

[LiveEdge® Compute]: source /data/local/vstream/etc/env.sh
[LiveEdge® Compute]: mkdir /data/local/observability
Use adb push to copy the files you downloaded and edited to the directory you just created, then build and run the Dockerfile to start Prometheus.
[Local Machine]: adb push . /data/local/observability

[LiveEdge® Compute]: cd /data/local/observability
[LiveEdge® Compute]: docker build -t videon-prometheus .
...
[LiveEdge® Compute]: docker run --restart unless-stopped -p 9090:9090 --name LiveEdgeGrafana videon-prometheus &
As you may have noticed in the prometheus.yml file, the system sends data to the Grafana Cloud roughly every 15 seconds. Let the server run for a few minutes, then log back in to your Grafana Cloud account and navigate to your Grafana dashboards by clicking on the "My Account" link in the upper right, then clicking on your instance in the left hand navigation, then clicking the "Login" button in the Grafana box. This will take you to a blank Grafana dashboard.
Click on the "Explore" link (it looks like a compass) in the left hand navigation, then select your Prometheus instance from the dropdown at the top. You may see a number of options in the dropdown - the one you want matches the name in the "Grafana Data Source Settings" on your Prometheus set up and usually ends with "-prom".
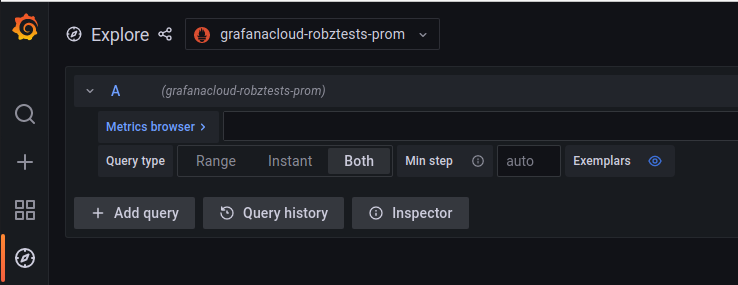
Confirm that Grafana Cloud is receiving the metrics from your device by clicking the "Metrics Browser" link. You should see a list of data similar to what you saw when you visited the node_exporter endpoint on your device.
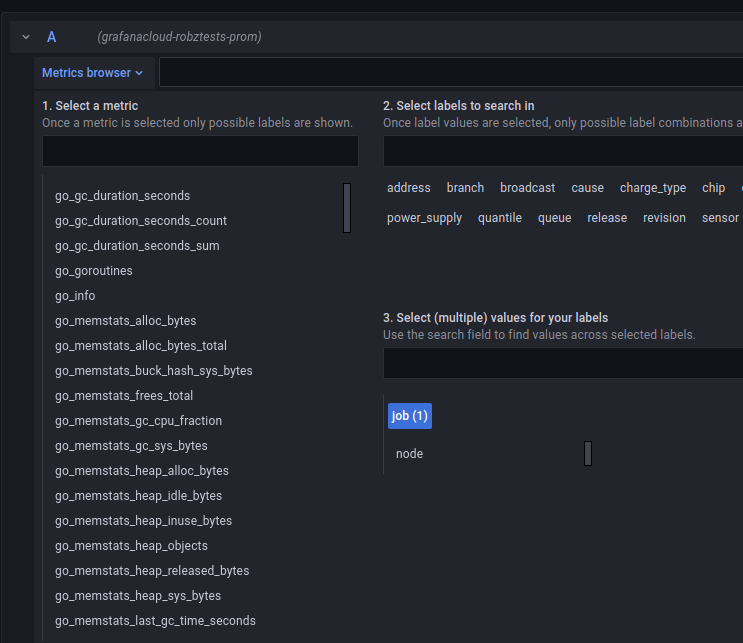
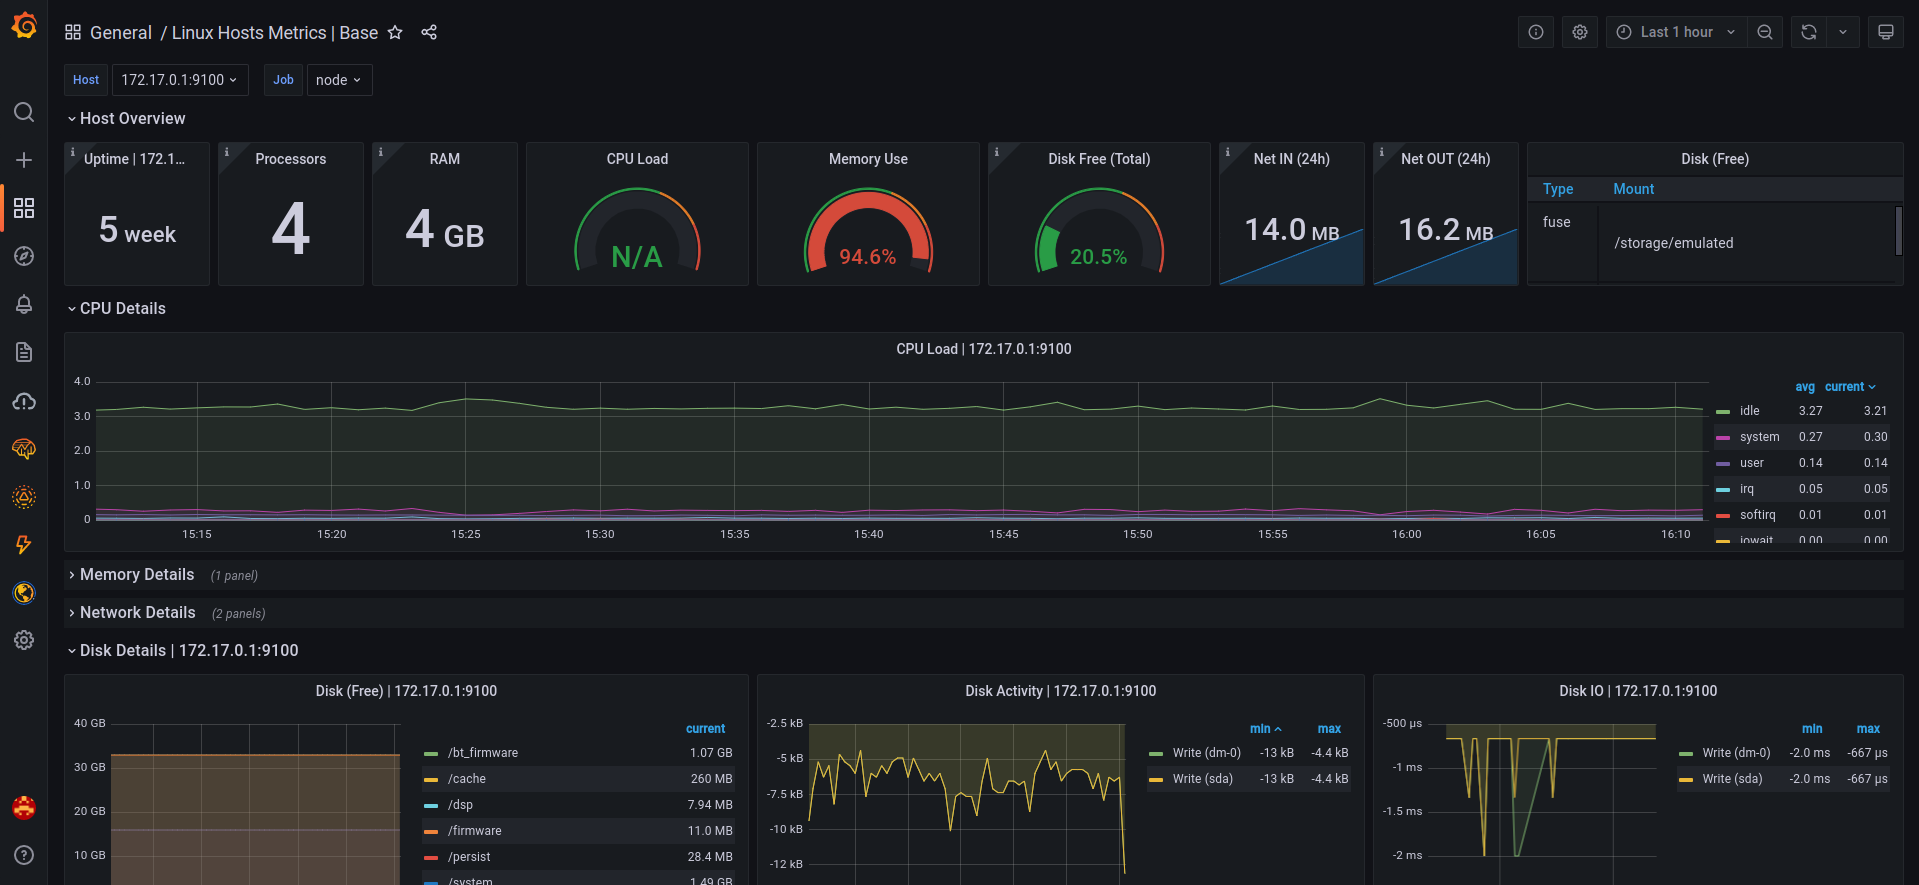
From here, you can create a custom dashboard, integrate this data with existing dashboards, or find a pre-built dashboard through Grafana's marketplace. Since LiveEdge® Compute is based on the Linux operating system, a good dashboard to start with is the "Linux Hosts Metrics | Base" (ID 10180) dashboard provided by Grafana.com. You can import this dashboard by hovering over the "Dashboards" link (it looks like a set of four boxes) in the left hand navigation of your Grafana dashboard page and clicking on the "Browse" link. This will take you to a dashboard management page.
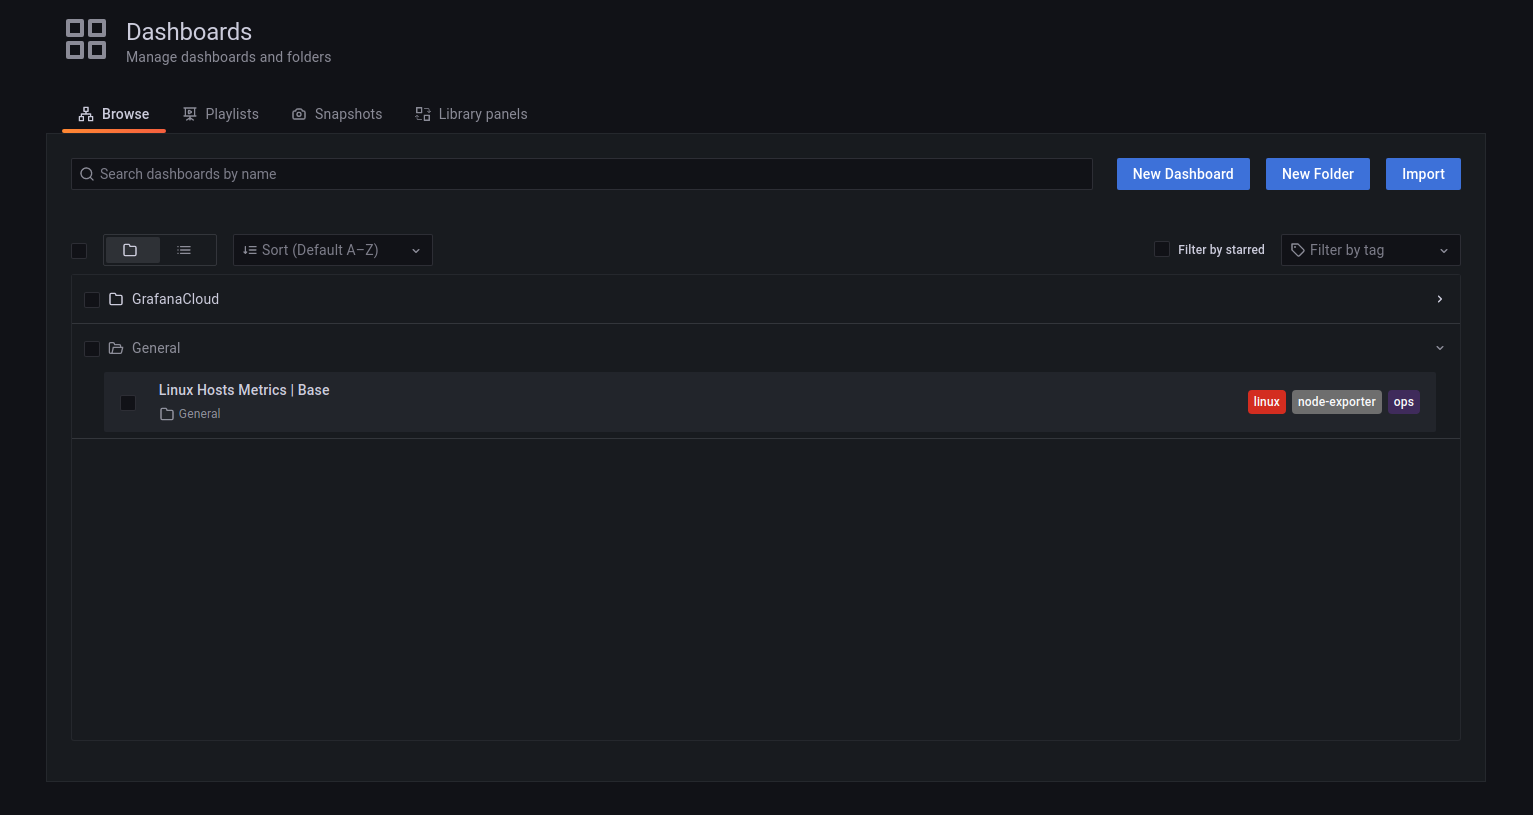 Click the "Import" button next to the search box.
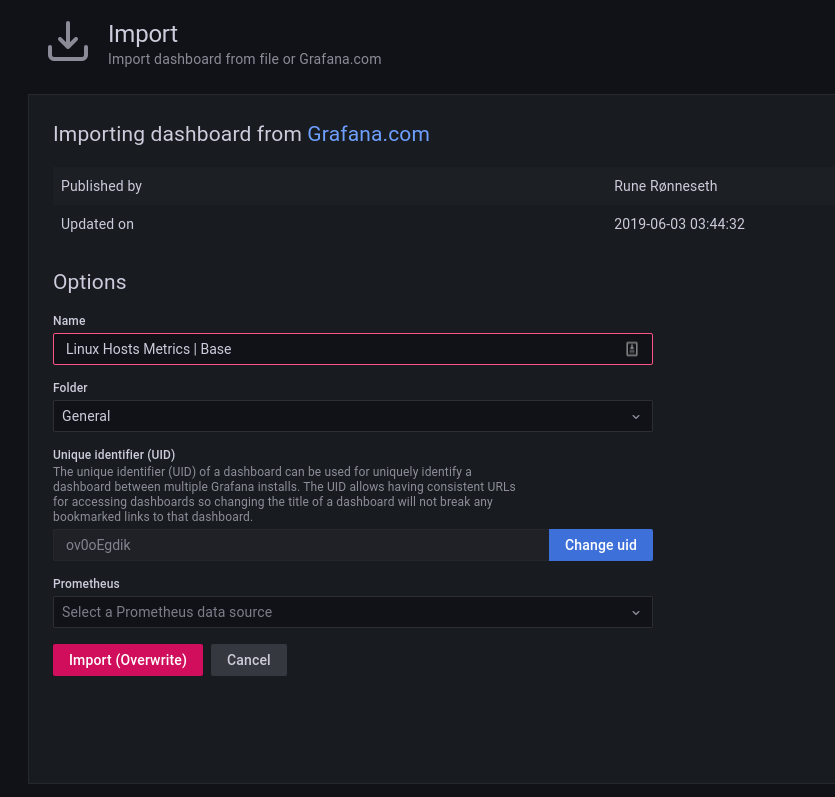
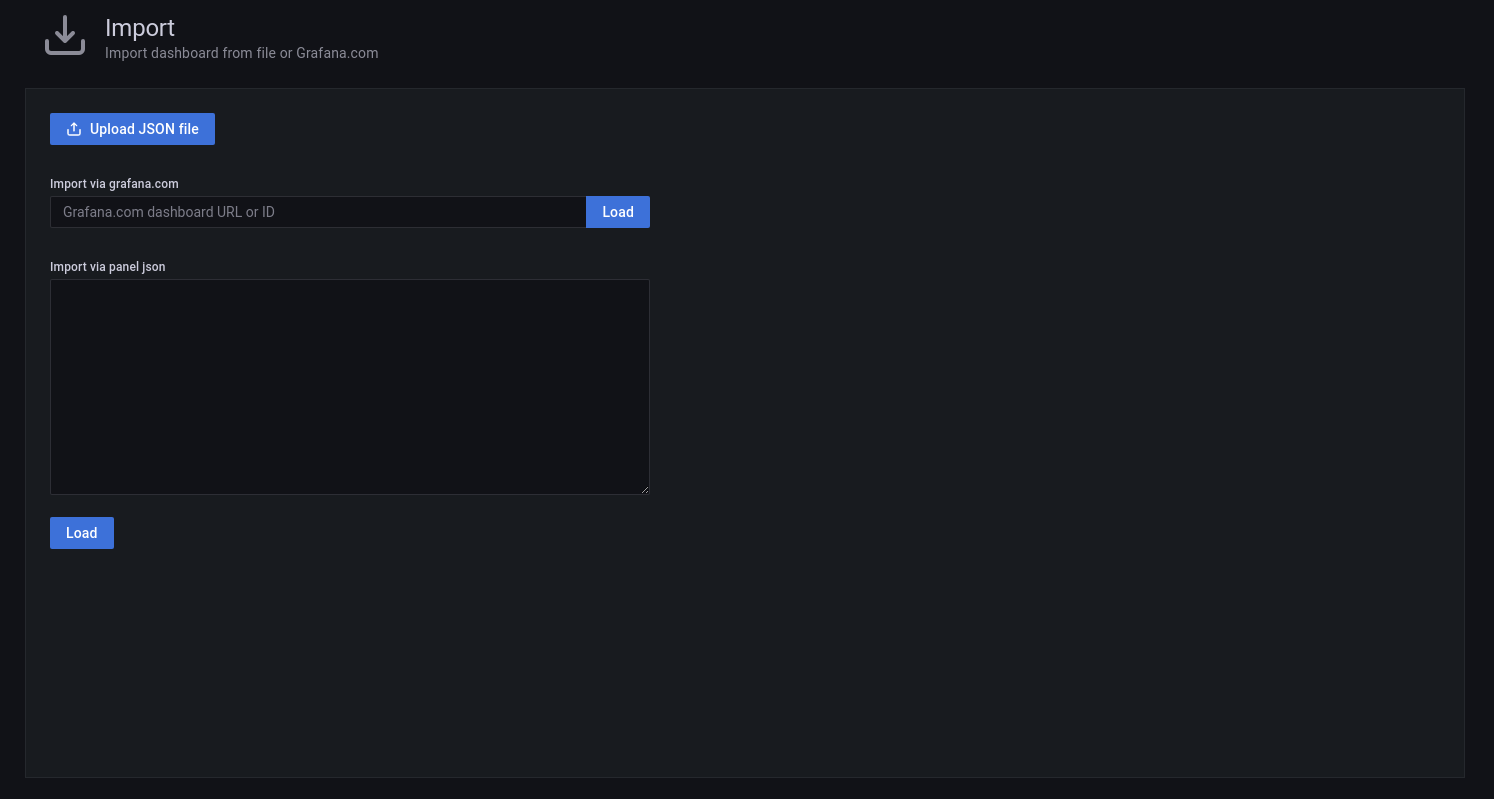 Enter "10180" - the ID for the "Linux Hosts Metrics | Base" dashboard - in the "Import via grafana.com" field and click "Load". The dashboard properties page will load. Be sure to select the correct Prometheus data source in the "Prometheus" dropdown near the bottom of the page, then click "Import".
If everything is set up correctly, you should immediately begin to see your dashboard's metrics populate.
Note that we installed Prometheus directly to our device for this example, but you may prefer to run Prometheus centrally on a server in your datacenter. Managing an external Prometheus and Grafana instance is beyond the scope of this tutorial, but we encourage you to visit the Grafana Labs documentation for more details to expand your observability stack.