Table of Contents
Dashboard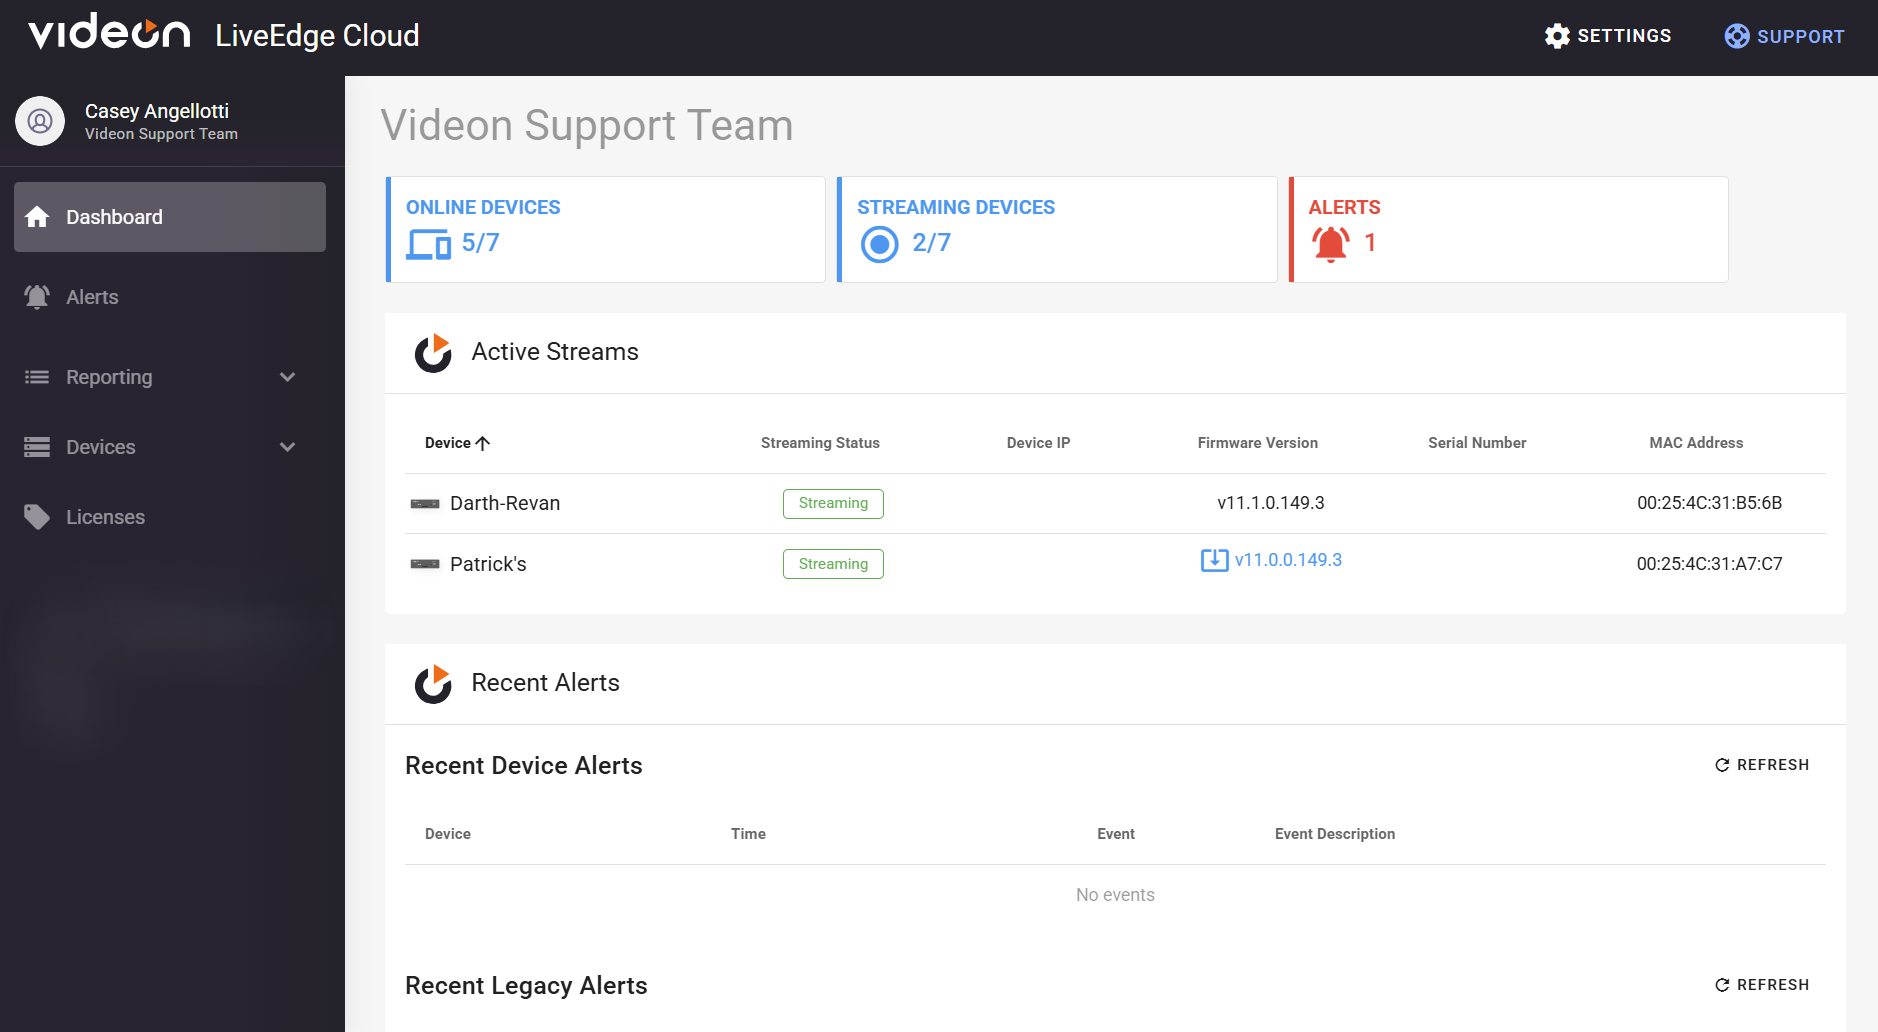
Active Streams:
For each row of your active streams, you will be given the device name, the device’s streaming status, the device ip, firmware version, serial number, and the MAC address.
- Streaming Status: Shows if you are streaming smoothly, or an easy way to tell that an error has occurred so you know to dig into find the error and solve it to revert back to successful streaming
- The Device IP: Helpful to know which network your Videon device is connected to. If your computer/laptop is on the same network as the Videon device, you can plug this IP address into a web browser for access to the device's local web UI.
- Firmware Version: Gives a quick status of what software and cloud version you are on. Also a very accessible way to update your Videon device to the latest version for both.
- Serial Number: Default device name. Quick check with the label provided on your device to make sure you are configuring the correct device.
- MAC Address: Way more accessible than digging through logs to help with certain workflows.
Recent Legacy/Device Alerts and Organization Events:
For each row, you will be given the device name, the time the alert/event occurred, the event name that occurred, and the event description.
- Time: The exact date and time to the nearest second the specific activity occurred.
- Event: States whether an alert was generated, silenced/unsilenced (and by whom), or resolved and closed.
- Event Description: Describes the alert type and what statuses changed at the time of the logged event.
- Option to refresh your alerts section.
Alerts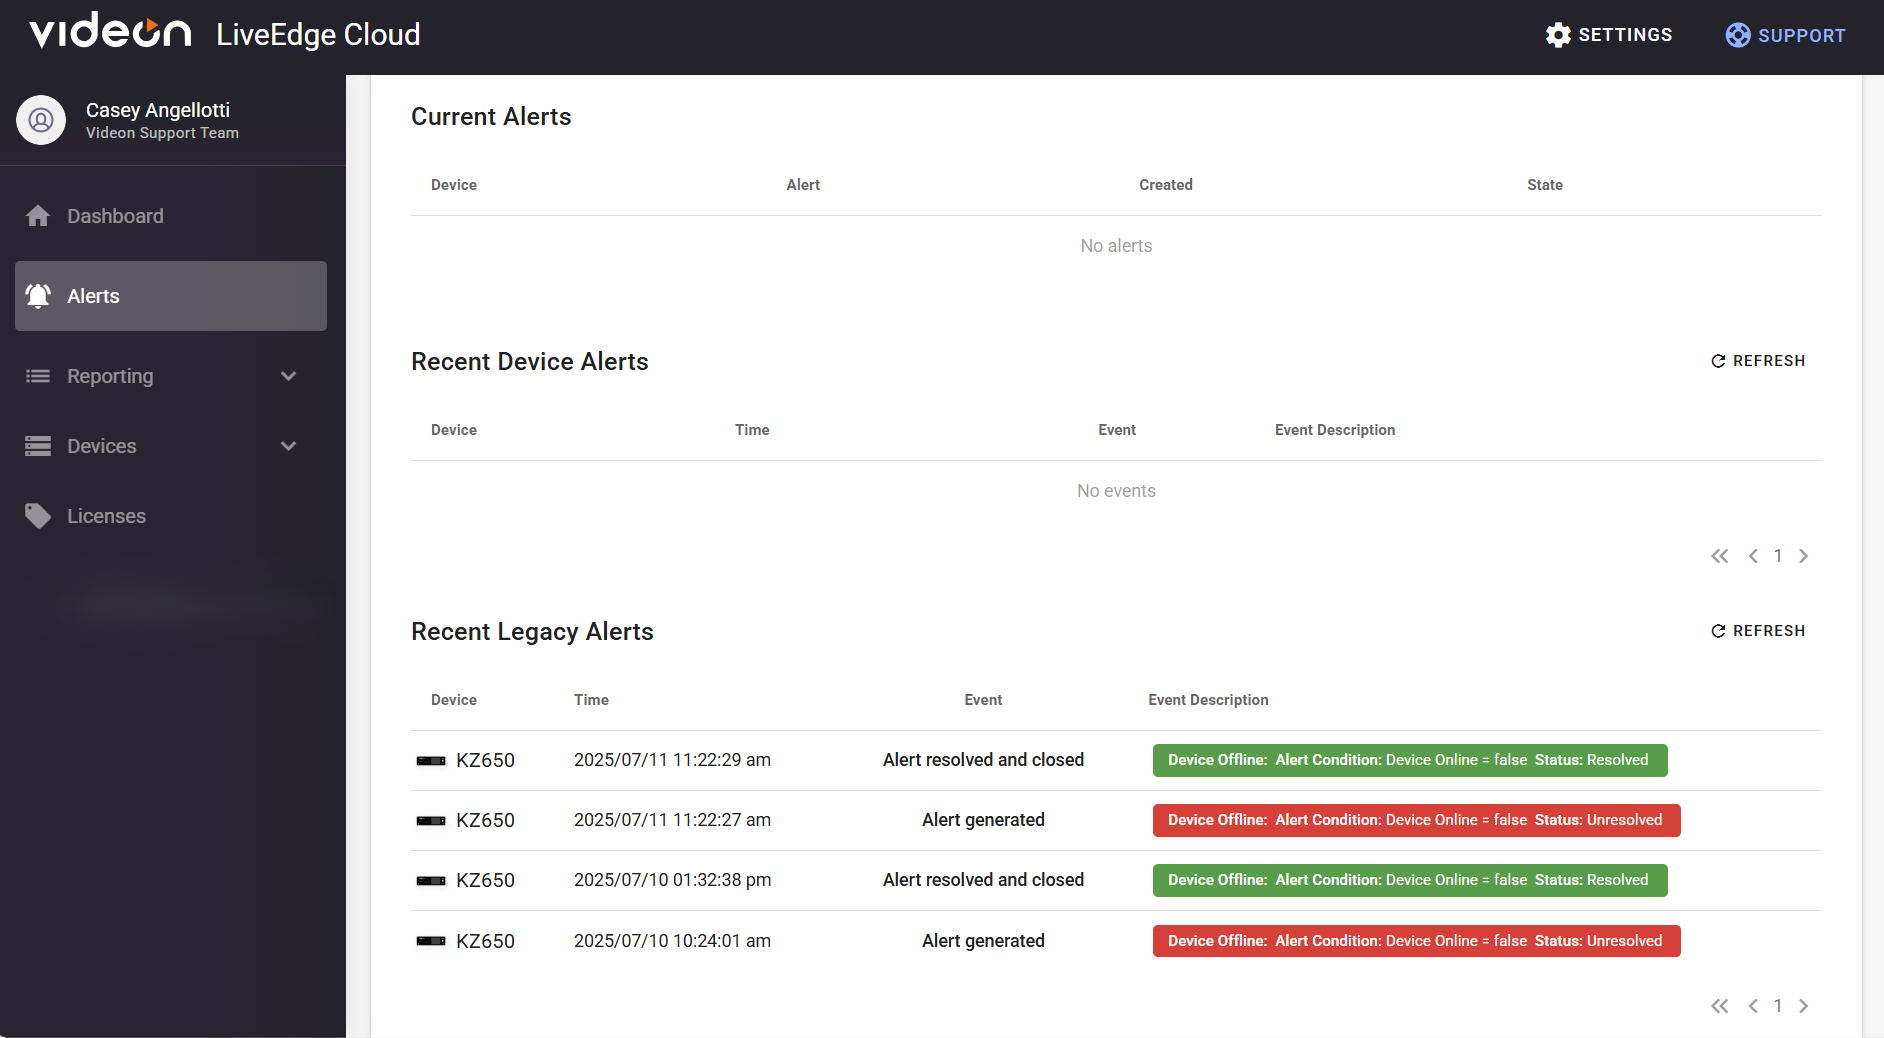
Provided is the current alerts, your recent device/legacy alerts (also provided on dashboard), and legacy settings.
Current Alerts:
- Shows your device name, the alert name for that device, when it was created, and the current state of the alert.
Recent Device/Legacy Alerts:
For each row, you will be given the device name, the time the alert/event occurred, the event name that occurred, and the event description.
- Time: The exact date and time to the nearest second the specific activity occurred
- Event: States whether an alert was generated, silenced/unsilenced (and by whom), or resolved and closed.
- Event Description: Describes the alert type and what statuses changed at the time of the logged event
Organization Alert Settings:
This section provides an enhanced alert selection from the Legacy alerts (below) and allows for the selection of users/e-mail addresses that you wish to be recipients of configured alerts.
- Click + CREATE ALERT to create a new organization-wide alert.
- Alert dropdown: shows a list of alerts that can be configured.
- Alert Name: can be modified to the desired name.
- Alert Config: displays the precise conditions under which the alert is generated using a Threshold Condition and Threshold Value
- Notification Recipients: allows you to select users within your organization that you wish to be an alert recipient. This can be configured for users within your cloud organization or by entering additional external email addresses.
Legacy Settings: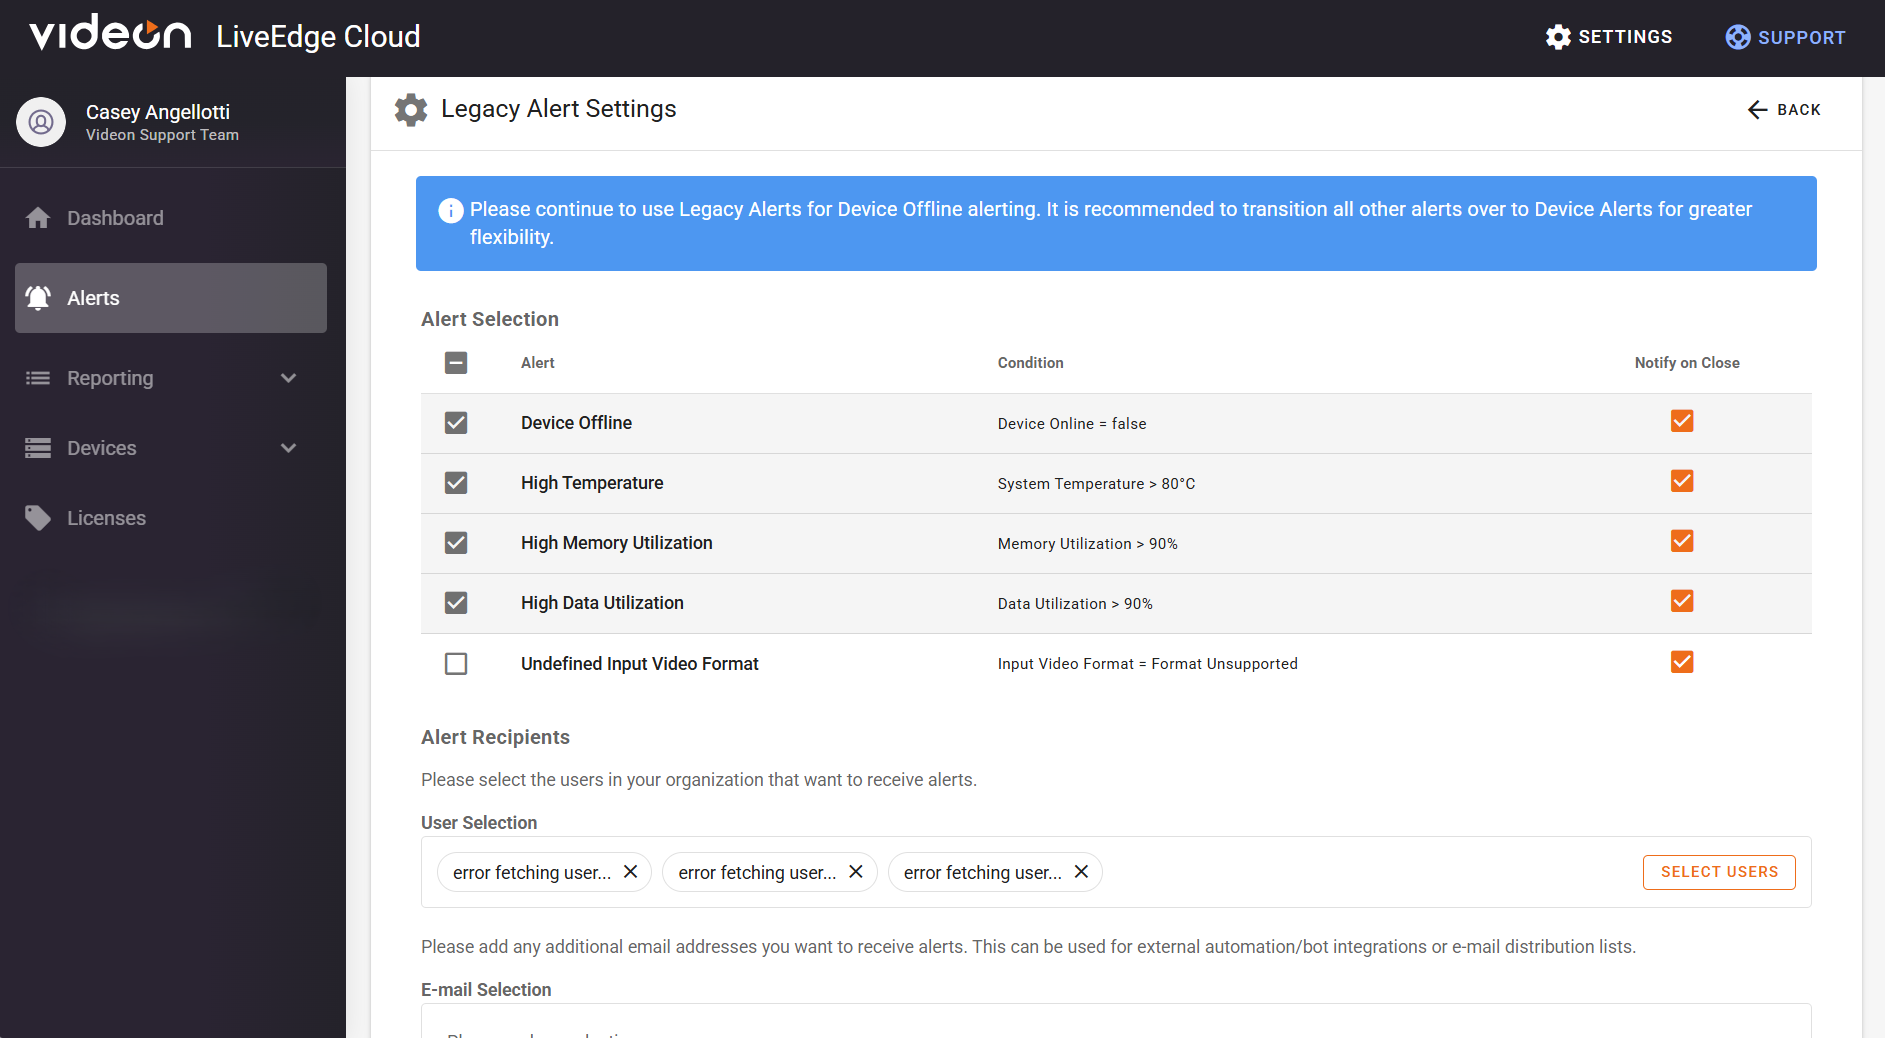
This section provides your alert selection and those users/e-mail addresses that you wish to be a recipient of selected alerts.
- Alert Selection: shows a list of alerts that can occur, states the conditions needed to generate that alert, and gives you the option to receive a notification when those conditions are met (as well as optionally for when the alert is closed, also).
- Alert Recipients: you can select users within your organization that you wish to be an alert recipient. Whether that just be through being a user within your cloud, or by choosing recipients to receive outside of cloud alerts on email.
Reporting
Events:
This presents the option to select a specific time period in which you would like to see events and below the events that occurred within your selected span.
Period Selection:
- A toggle with choices of within the last hour, last six hours, last day, last 2 days, last 5 days, last 30 days, and also a Custom Date Range.
- Beside the toggle is showing the span, specific to the nearest second, of time in which you will view events from
Events:
For each row, you will be given the device name, the time the alert/event occurred, the event name that occurred, and the event description.
- Time: The exact date and time to the nearest second the specific activity occurred
- Event: States whether an alert was generated, silenced/unsilenced (and by whom), or resolved and closed.
- Event Description: Describes the alert type and what statuses changed at the time of the logged event
- Option to refresh event’s section
Metrics: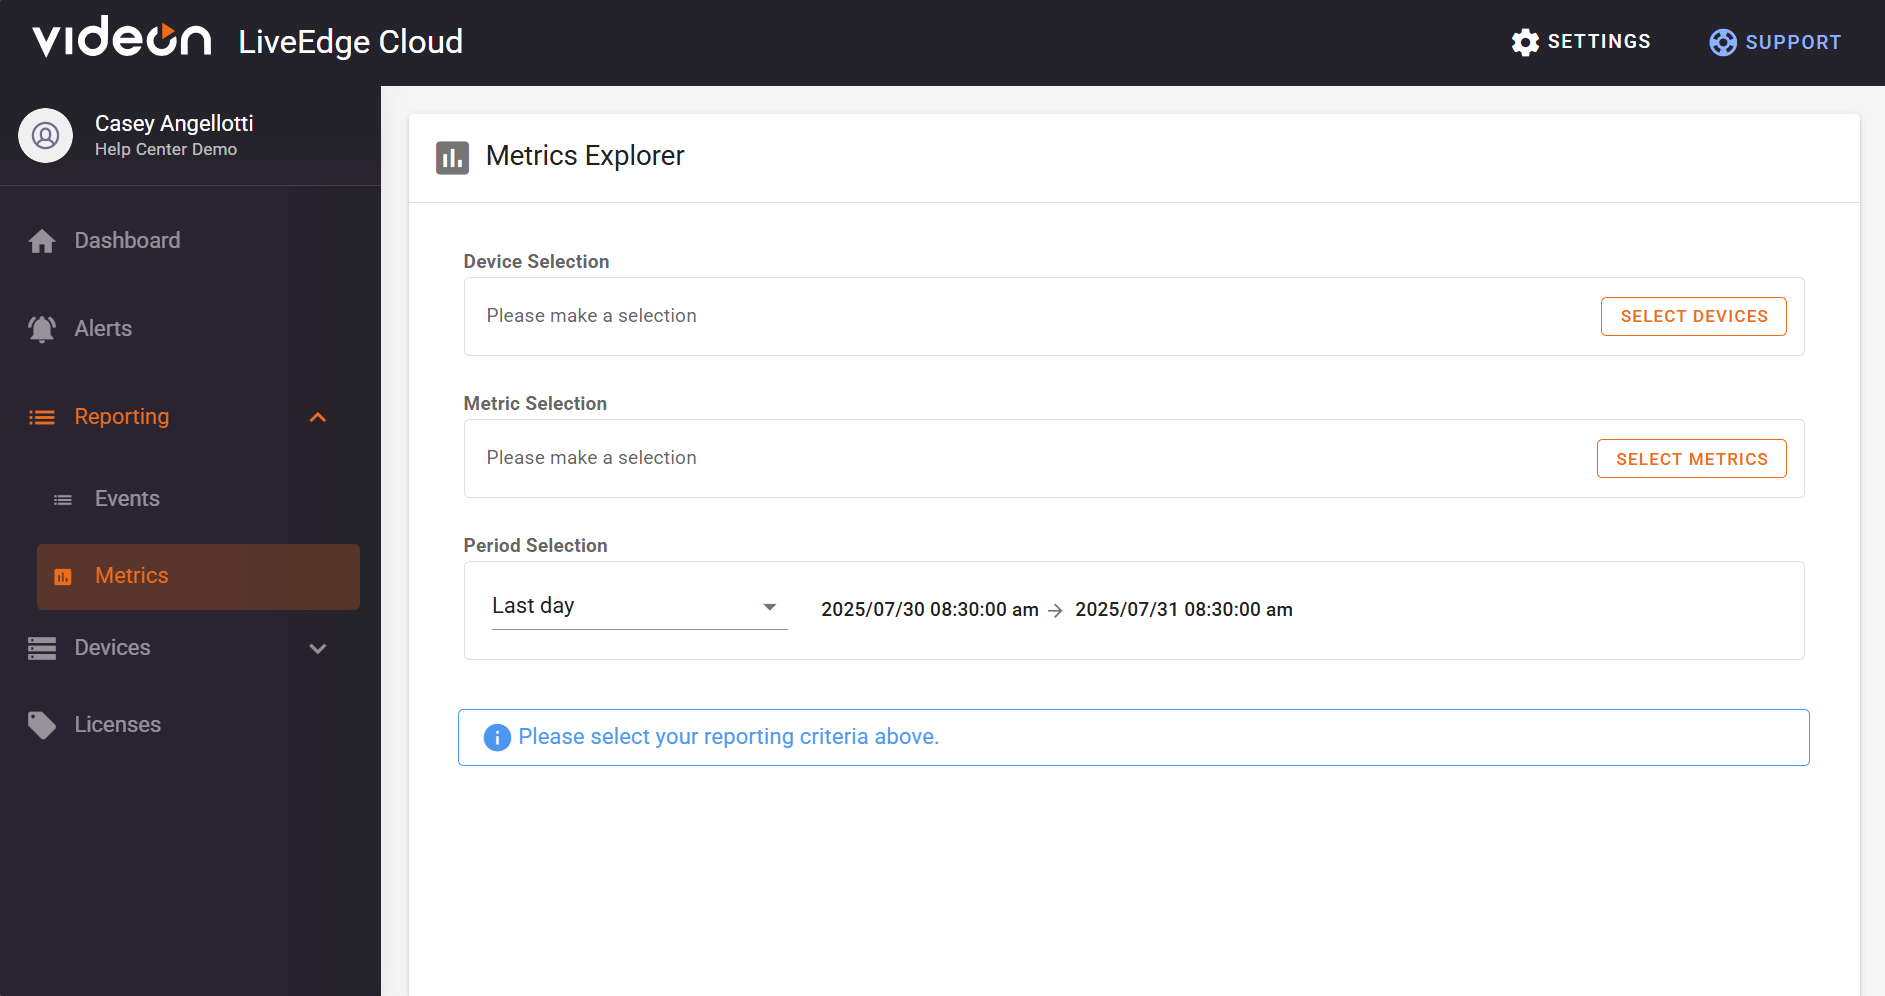
Provides a device selection section to get specific on the device you wish to review, metric selection section to get specific on what exactly you wish to review, and again the period selection section so you can look at a selected time span of your choosing.
Device Selection:
By clicking on select devices, a popup will show giving a list of devices. Providing each of their names, streaming statuses, and their device ip address. To quickly find a specific device(s), you can search up it’s serial number. After checking off the device(s) of your choosing on the left side of the popup, you must simply click select to lock in your decisions.
Metric Selection:
- By clicking on select metrics, a popup will appear giving a list of different toggles to look within to select the metrics of your choosing.
- Toggles are Processors, Thermal, Network, Memory, and Filesystem.
- Processors: 15min Load Average, CPU Utilization(ALL), and GPU MHz
- Thermal: System Temperature
- Network: Ethernet Bytes Sent/Second, Ethernet Bytes Received/Second, localhost Bytes
- Sent/Second, and localhost Bytes Received/Second
- Memory: Memory Utilization
- Filesystem: Data Utilization and Persist Utilization
- After checking off your desired metrics, simply click select in the bottom right-hand corner
Period Selection:
- A toggle with choices of within the last hour, last six hours, last day, last 2 days, last 5 days, last 30 days, and Custom Date Range.
- Beside the toggle is showing the span, specific to the nearest second, of time in which you will view events from
Timeseries Graph/ Metrics Data:
Once your desired criteria has been selected, a Timeseries Graph and Metric’s Data should appear at the bottom of the page.
- Timeseries graph: Different colors/shapes will be provided on the lines within your graph to differentiate selected metrics and devices (if multiple devices are selected). The x-axis is measured to the nearest second of over the selected period, and the y-axis is specifically formulated to the metric selection. For example, System Temperature would be a range of the temperature in degrees Celsius from the lowest value detected over the selected course of time to the highest value that's been detected over the selected course of time. For Memory Utilization or CPU Utilization, it would be a range from 0 to 100%.
- Metrics Data: Provides data of a timestamp, the device(s) selected matric data to the nearest hundredth of a unit.
- Within this section, you can also download your data by selecting Download CSV on the upper right side.
Devices
All Devices: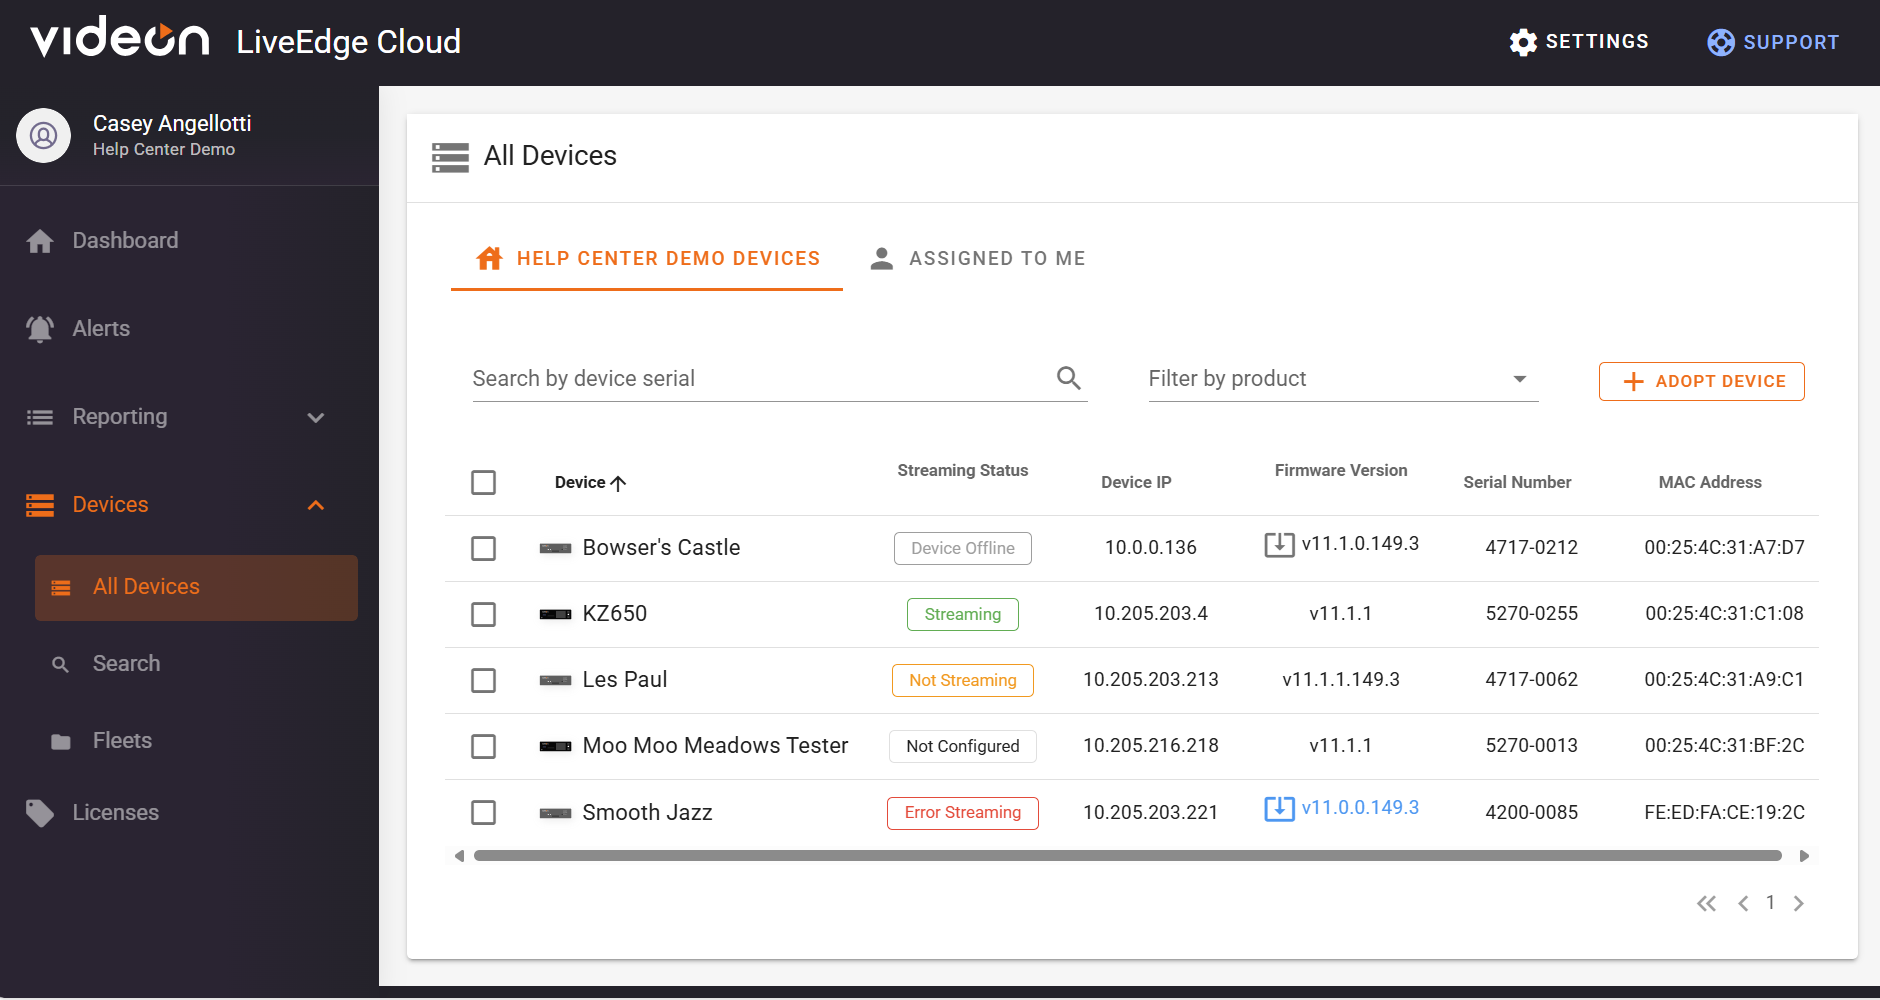
Organization Devices:
This page provides a way to search for devices within your organization filtered by their serial number and product type. This page also provides a way to adopt devices by serial number to your organization that have been assigned to you. Below these filtrations, you are provided with a list of devices that appears the same as what is displayed in the Active Stream section in the Dashboard tab.
Assigned to Me:
This tab presents a way to search for devices by serial number and product type to find a device that have been specifically assigned to you. Within this page, you can also adopt a device by its serial number. The list below is displayed the same way as the Organization Devices tab.
Search: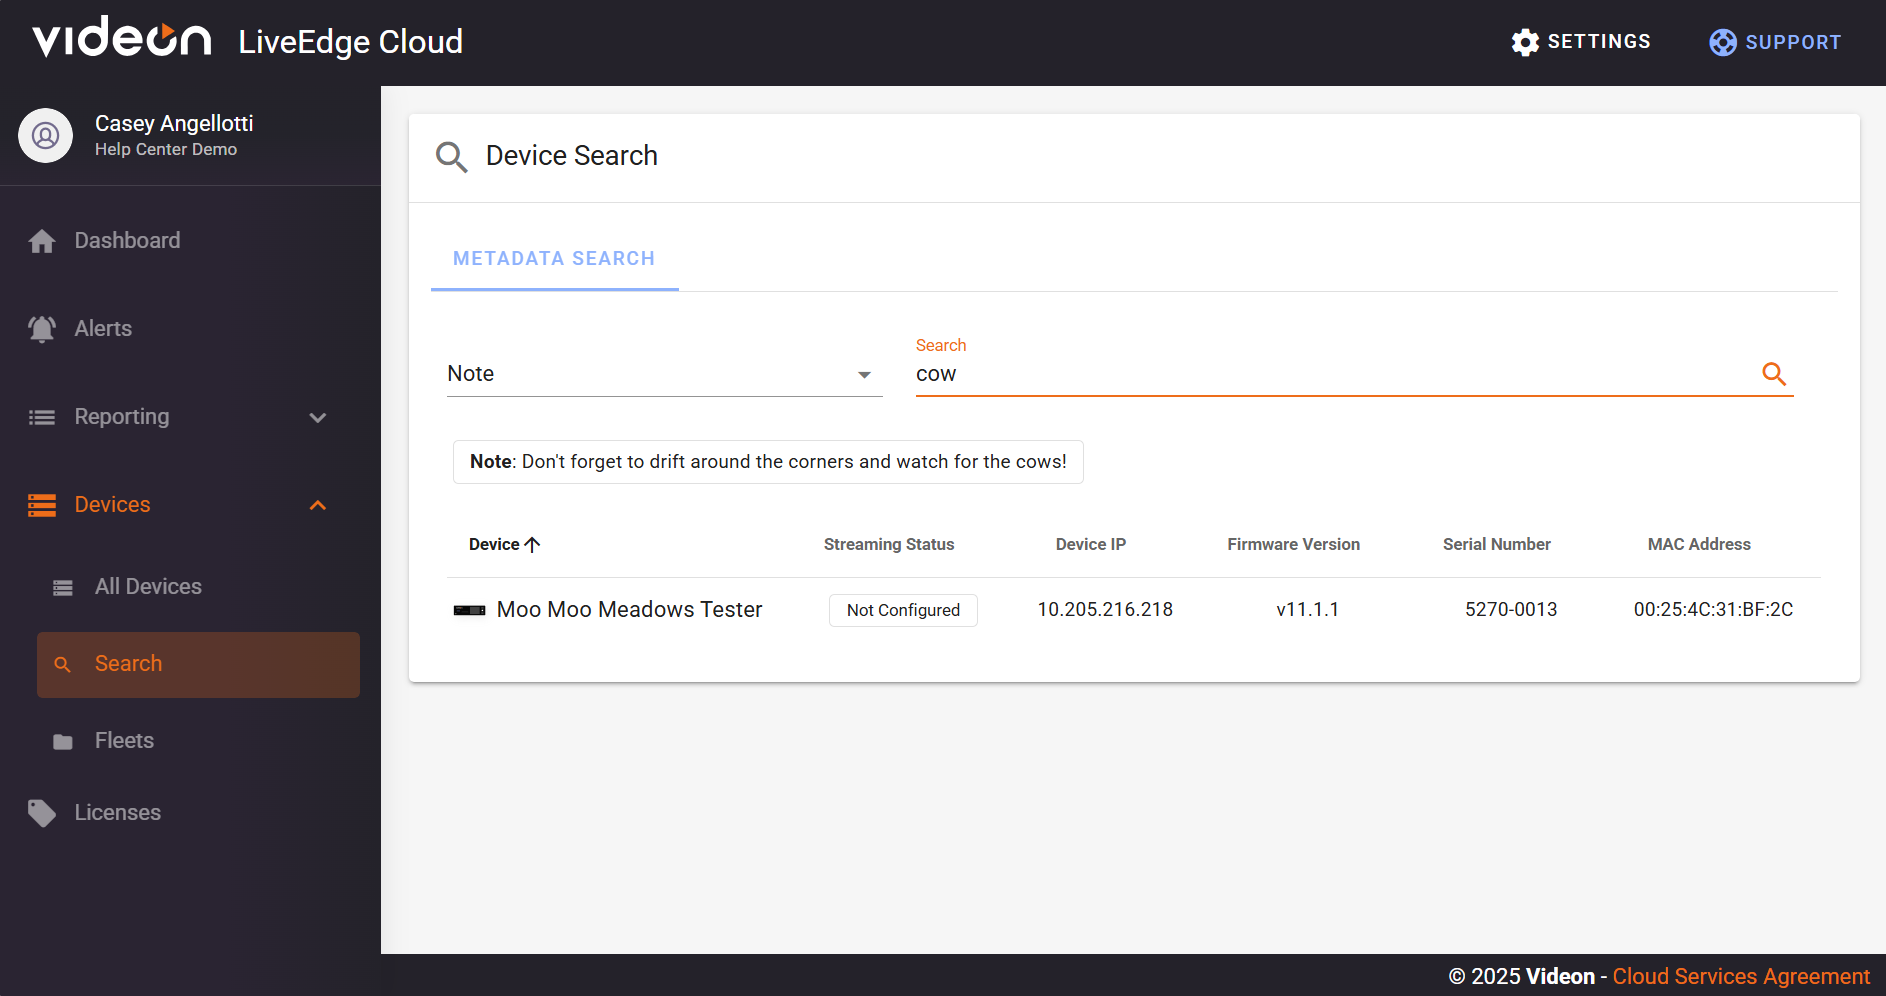
Within each device’s configuration page, you can create device-specific Metadata by clicking on Metadata near the top right corner. The types of metadata you can create are: Deployment Status, Device Alias, Location, and Note. Once you’ve selected one of the four as your data keys, you can then write your data in the box beside and click save. This feature not only provides a way for you to store data within each device, but it also allows another device-specific filtration that you can search for. In the search page, you can filter your search by your Metadata key or search the data that you had written. Below these filtrations, you will be provided with a list of devices that contain the metadata you’ve searched for.
Fleets: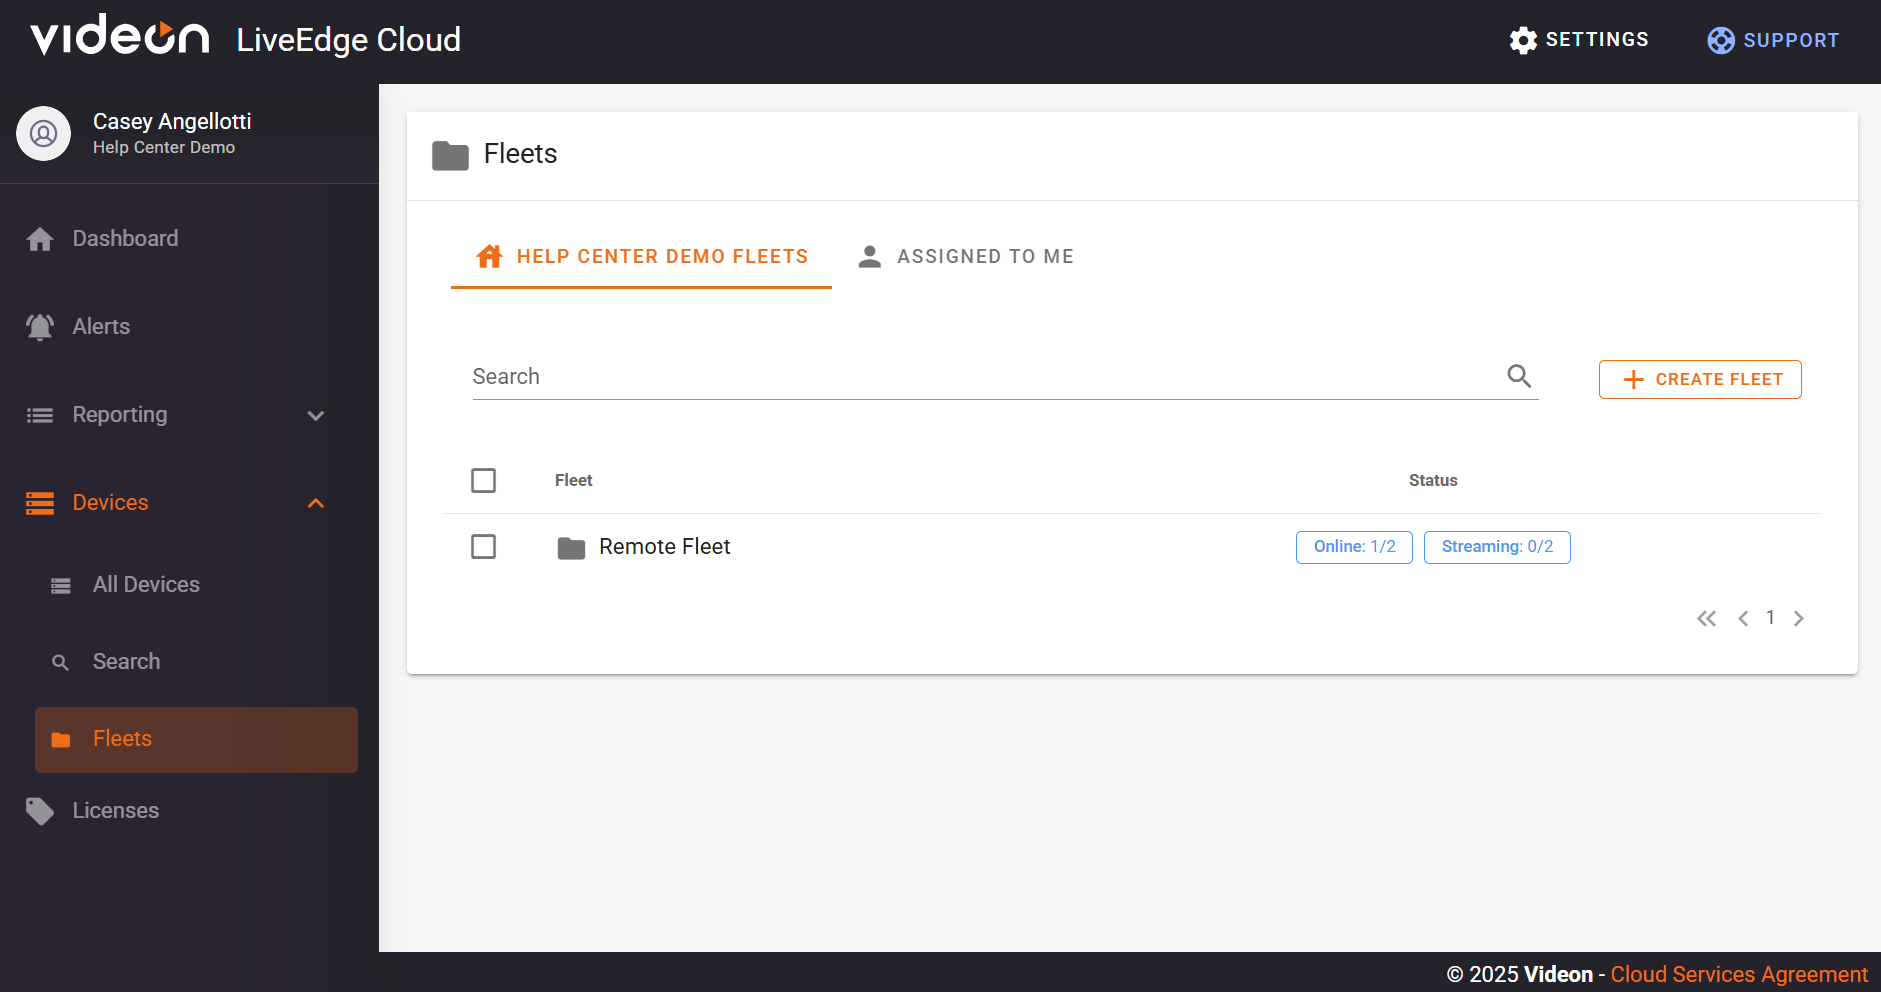
Organization Fleets:
This page displays a list of fleets within your organization, a way to search for a specific fleet, and the option to create a new one. Each row of the fleet list states the fleet name and a quick status of the devices in that fleet. Fleets store several devices and can be helpful if you have large quantities of devices and wish to keep track of smaller batches of the overall quantity.
Assigned to Me:
This page exhibits nearly the same way as the Organization Fleets page. You can be invited to a fleet from a LiveEdge Cloud organization that you are not a member of with a fleet-only specific access level. Fleets like these will appear here. You cannot create fleets from this page.
- More on fleets and what they do can be found in this article.
Fleet Alerts:
This section provides the ability to configure alerts specifically configured for only one fleet of your organization, and allows for the selection of users/e-mail addresses that you wish to be recipients of configured alerts.
- Click + CREATE ALERT to create a new organization-wide alert.
- Alert dropdown: shows a list of alerts that can be configured.
- Alert Name: can be modified to the desired name.
- Alert Config: displays the precise conditions under which the alert is generated using a Threshold Condition and Threshold Value
- Notification Recipients: allows you to select users within your organization that you wish to be an alert recipient. This can be configured for users within your cloud organization or by entering additional external email addresses.
Licenses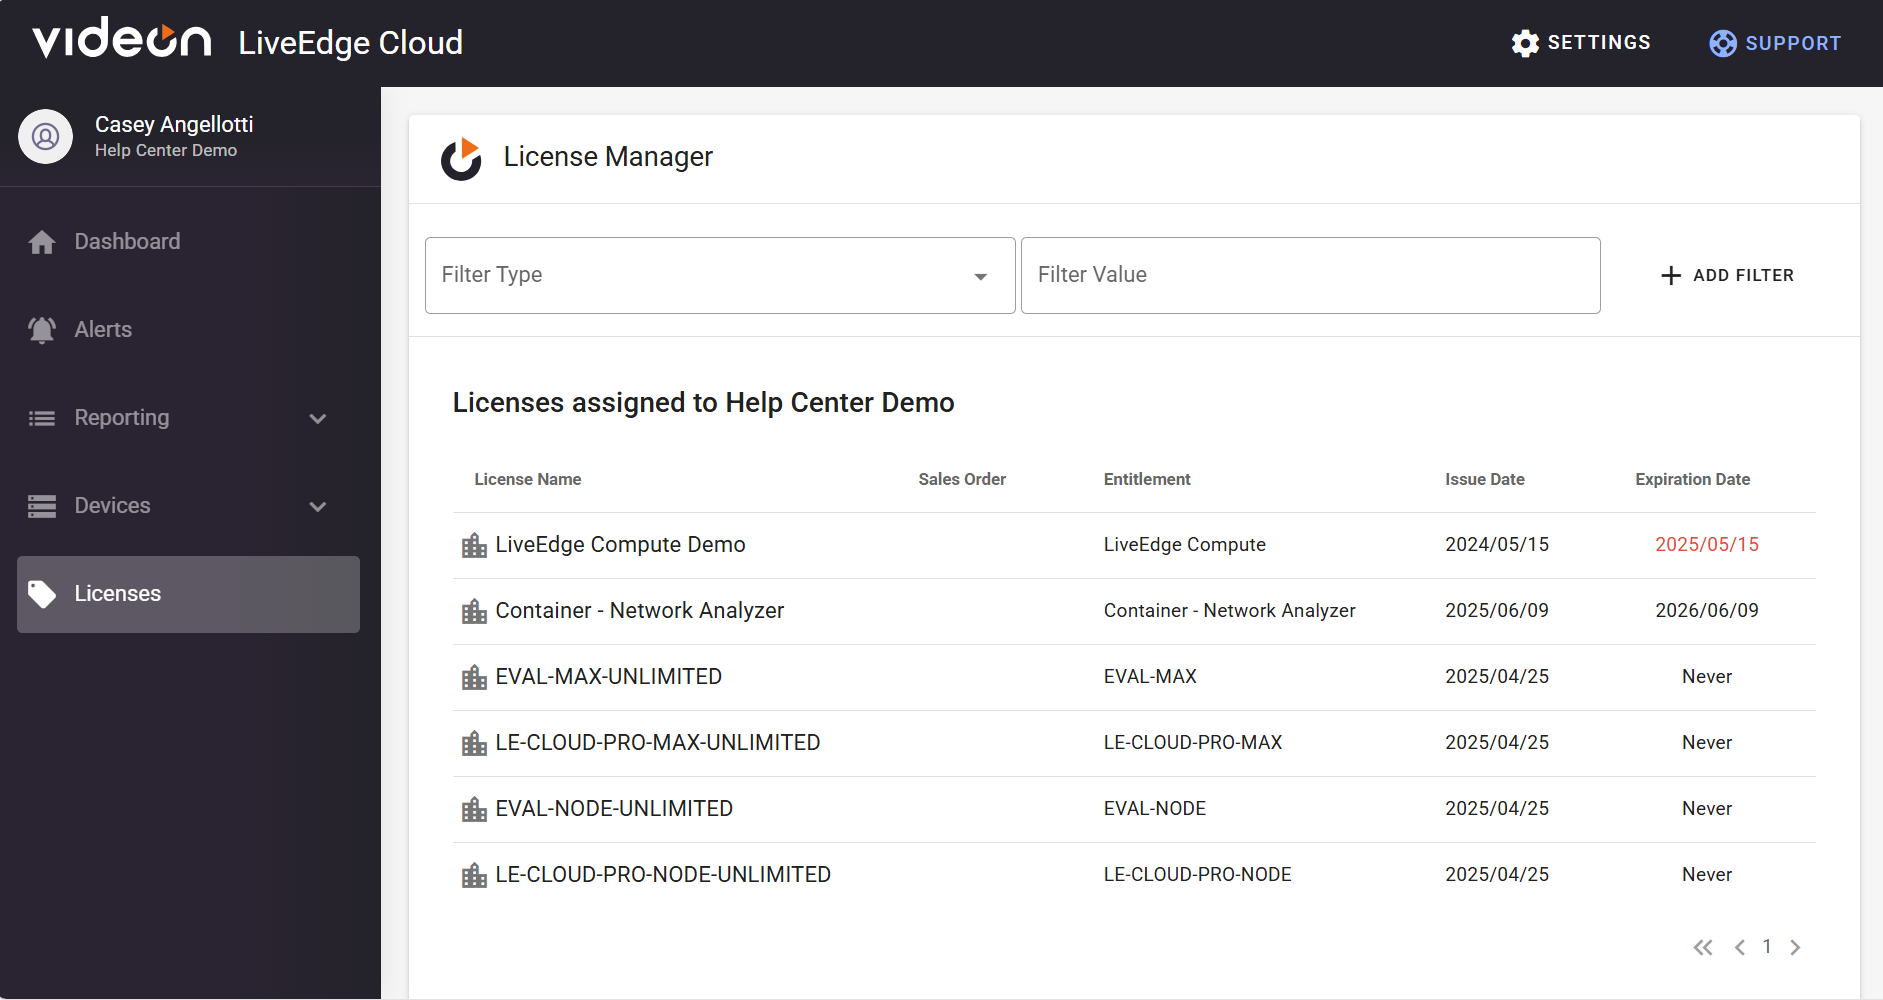
License Manager:
This page provides a list of licenses that have been assigned to your organization. Each row of the list includes the license name, license type, license platform, issue date, expiration date, and the option to manage the allocation of the licenses to the devices in your org.
- License Type: Shows if the license is per device or unlimited. If the license is per device, it states how many devices can be allocated to this license and how many of the licenses are already in use.
- License Platform: States the product type of the license
- Issue Date: The date the license was assigned to your organization
- Expiration Date: The date that your license will be unassigned
- Manage Allocation: The option to change the devices that are allocated to the license
Settings
Manage Account:
My Account: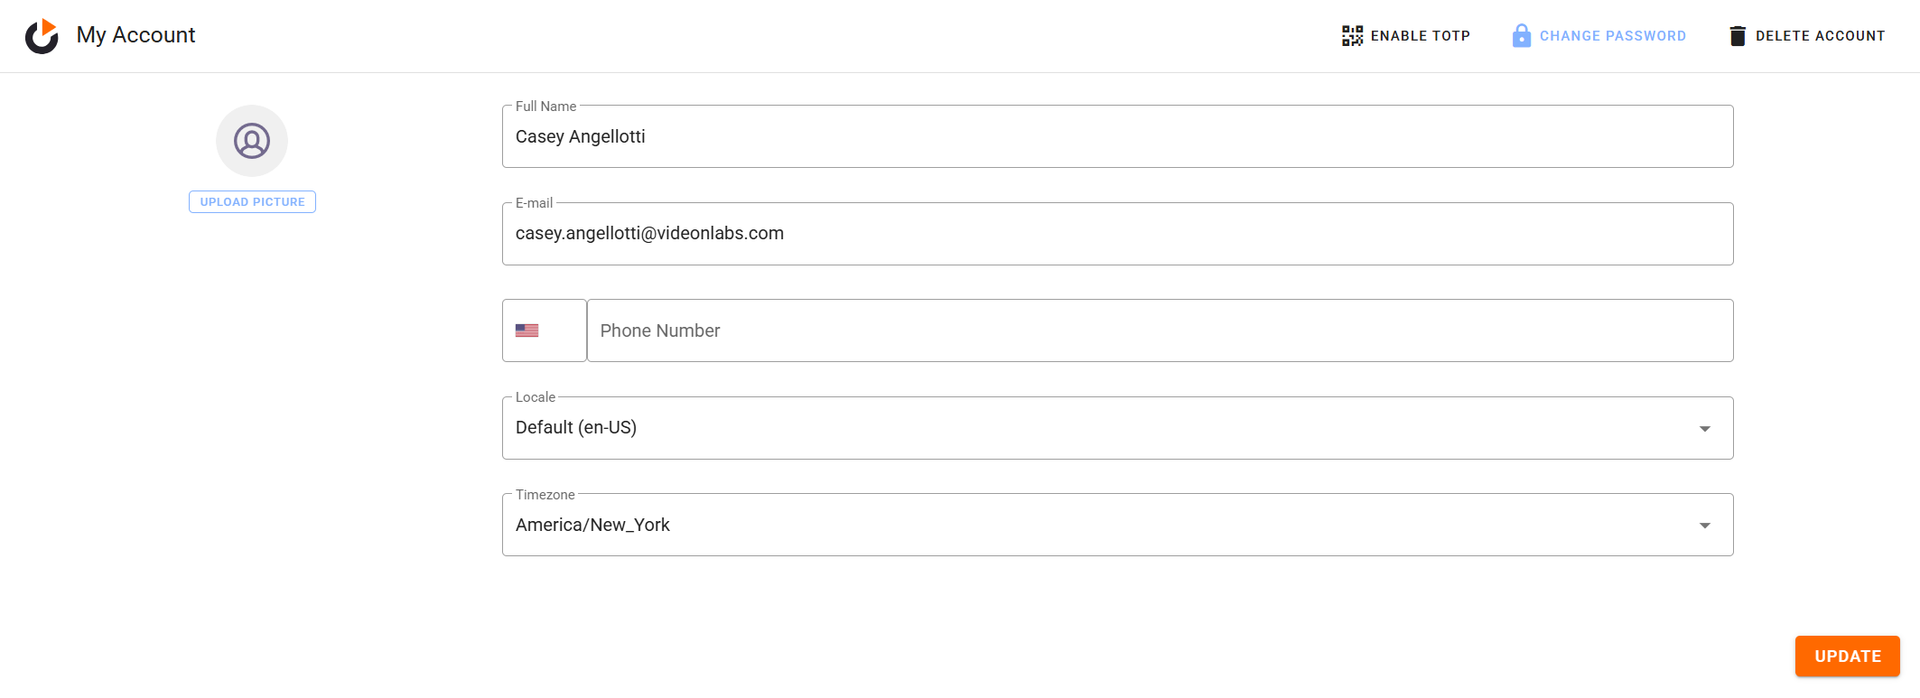
In this section, you are able to manage the basics of your account such as your profile picture, your name, your email, your phone number, your locale, and your timezone. Along with these basics, if you are signed in with a username and password (not SSO) you can also enable TOTP with a QR code and authentication, change your account’s password, and choose to delete your account.
Browser Specific Settings: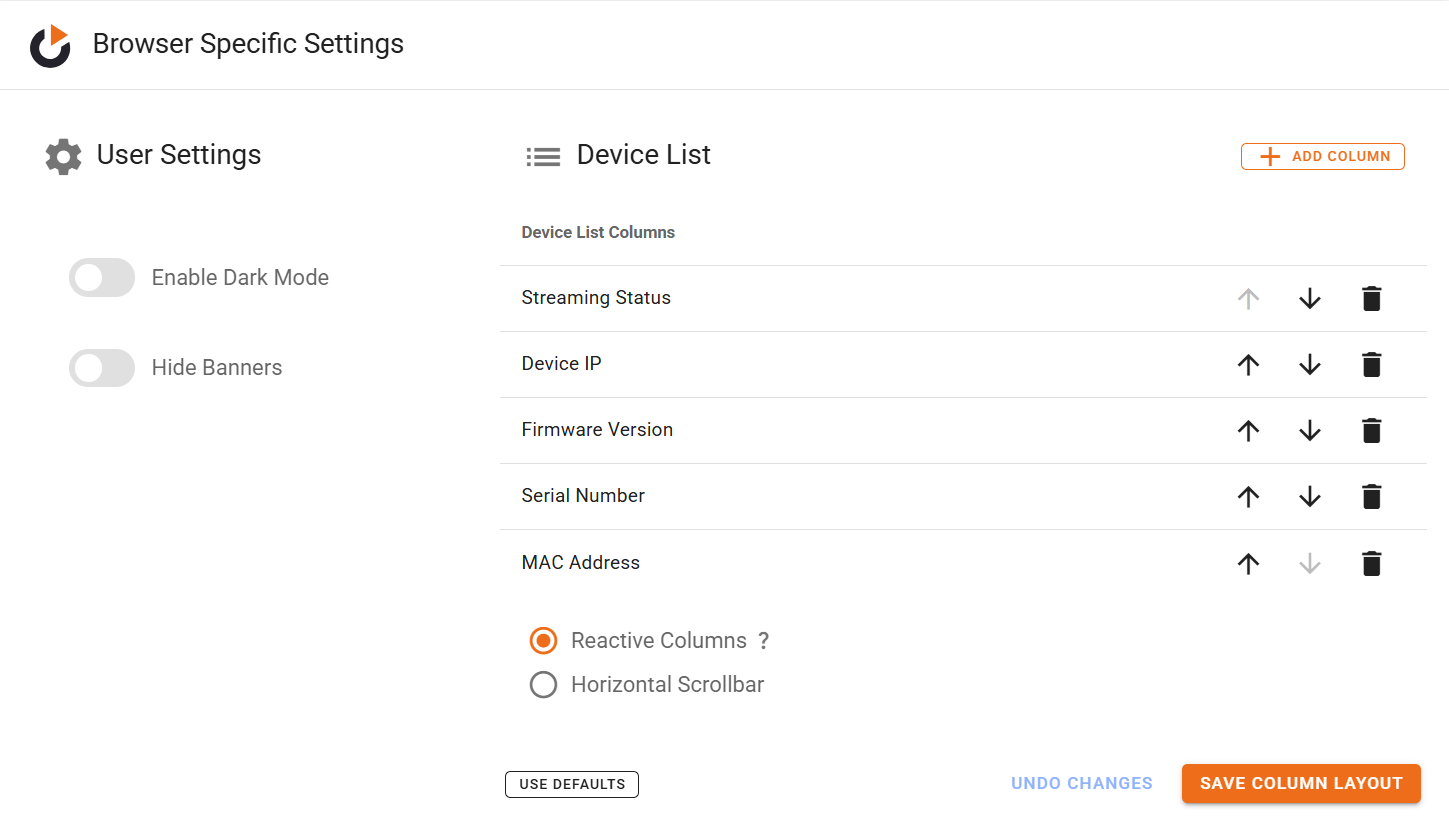
Within this section, you can toggle your user settings by enabling dark mode, hiding banners, and device list column settings.
- Device List: You can change your column settings by changing the order your columns are in, deleting/ adding columns, and choosing to have reactive columns or a horizontal scrollbar. To lock in your changes, select save column layout. To revert the changes you just made, click undo changes. To go back to the default settings, select the use defaults button.
Access Tokens: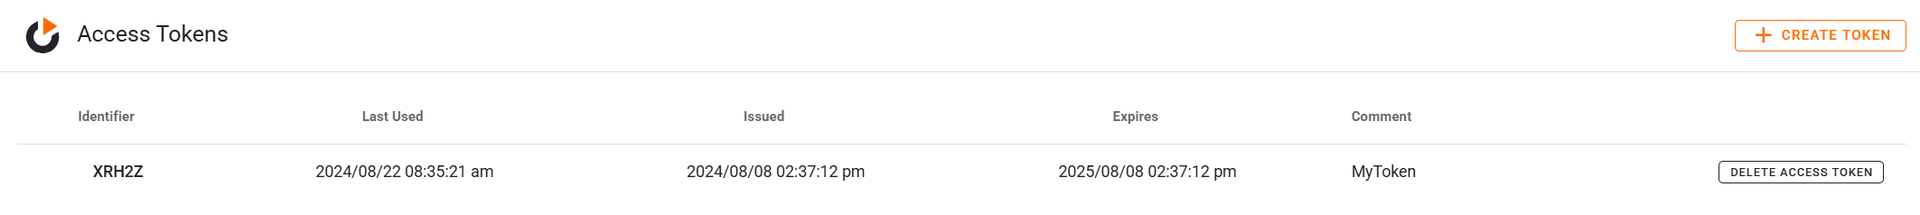
In the bounds of this section, you are given a list of different access tokens. You can delete any tokens in the list by selecting delete access token or you can create a new token by clicking create token. Each row of the token list provides you with the identifier, last used, issued, expires, and a user-defined comment of the token.
- Last Used: Date and time to the nearest second of the last time you used the token
- Issued: When the token was created/assigned
- Expires: The date and time to the nearest second of when you can access the token until
Switch Organization: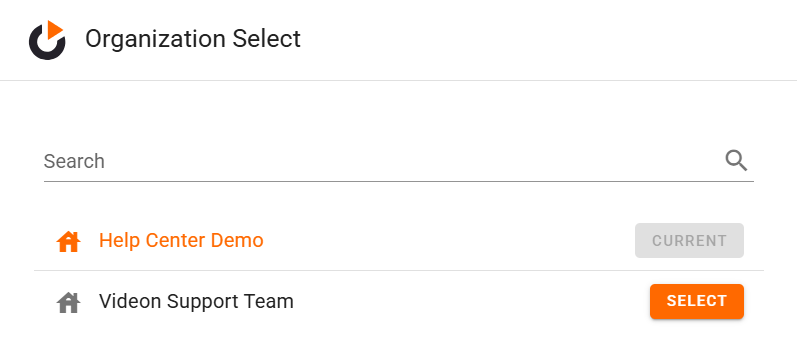
Organization Select: On this page, you are provided with the ability to search and select an organization that you have been invited to. You can also view the name of the organization you are currently in with the grey current box beside the name, and the organizations available for you to select into with the orange select buttons beside the names.
My Organizations: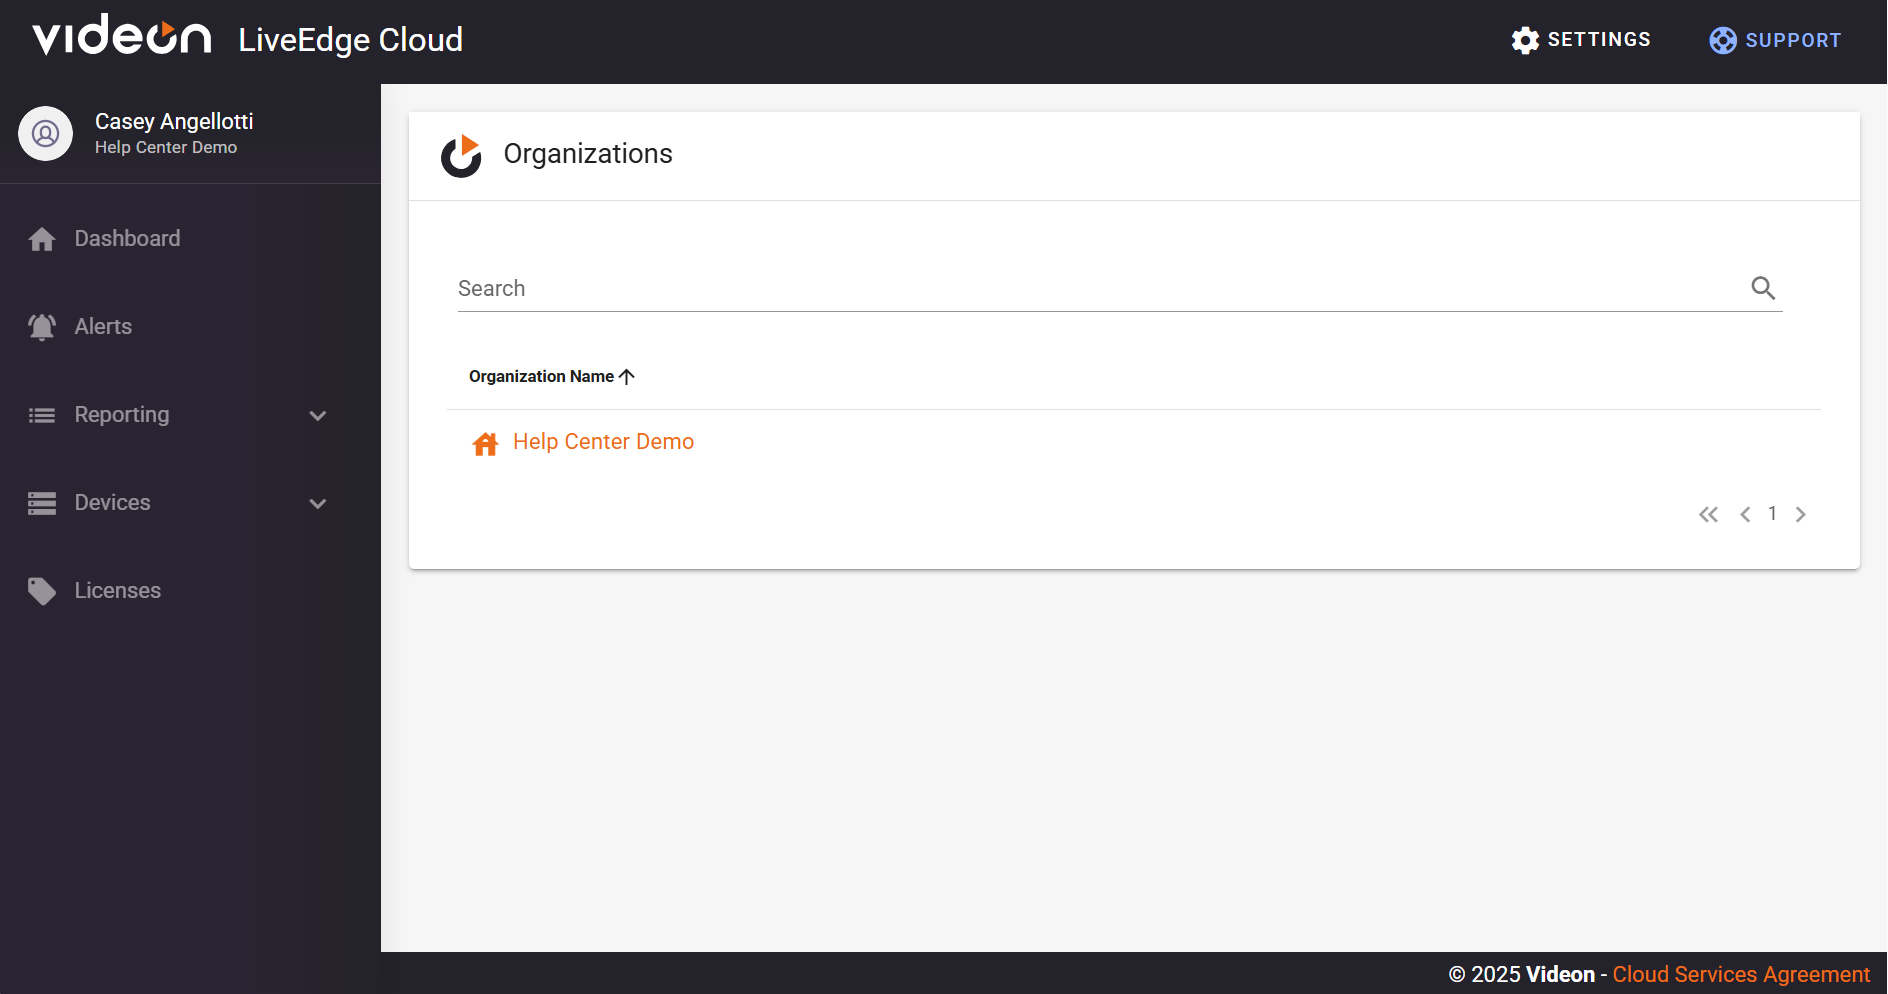
Organizations: This page is a list of the organizations that you have access to. If you are an Admin, you can click on any Organization you’re part of to view and manage the users within the org. If you need to delete an org, please contact Videon support for assistance.
Logout:
One easy click to log you out of the account you are currently signed into.
Support
This button in the top-right corner is an easy way to access this article, and our Videon Help Center.